Lets explore some of the tricks to monitor and improve performance of apps running in Eclipse and also how we can write better API.
1. VisualVM is a great tool to monitor the performance of any eclipse application. Once the plugin is installed, any eclipse app can be launched in the VisualVM Runtime instead of a Java Runtime so that the health of the app can be monitored in real-time.
2. If we enable "Show Heap Status" under 'General Preferences', we can periodically enforce GC, which is very important for heap analysis.
3. Now we can really enable in-depth monitoring by turning on Runtime Spy through an .options file e.g. eclipse -debug c:\spy\.options
Here is the Update site for core tools
platform-core - http://eclipse.org/eclipse/platform-core/updatesReferences :
http://www.jdg2e.com/ch32.performance/doc/index.html#refs
Google Book
http://www.eclipse.org/eclipse/platform-core/downloads/tools/readme.html
Sample settings of the Runtime Spy .options file
#### Monitoring settings
# monitor class loading
org.eclipse.osgi/monitor/classes=true
# monitor bundle activation
org.eclipse.osgi/monitor/activation=true
# monitor resource bundle (*.properties) loading
org.eclipse.osgi/monitor/resources=true
#### Trace settings
# trace class loading - snapshot the execution stack when a class is loaded
org.eclipse.osgi/trace/classLoading=true
# trace location - file in which execution traces are written
org.eclipse.osgi/trace/filename=runtime.traces
# trace filters - Java properties file defining which classes should
# be traced (if trace/classLoading is true)
etc........
4. Well even after enabling all types of monitoring, we still sometimes can not find out why certain apps leads to OutOfMemory Error !
Then the only way out is to generate the Heap Dumps and Thread Dumps.
We can add this vmarg in eclipse.ini -
-Xdump:java+heap+system:events=user,opts=CLASSIC+PHD so that whenever SendSignal
Otherwise we can start eclipse in command prompt as follows and then do Ctrl+break to signal the vm.
eclipse -vm
Another way to send stop signal to vm - cdb -p
5. Time to highlight the importance of designing API and SPI using eclipse codebase.
This is an invaluable source of knowledge about evolving Eclipse API and proper usage of annotations like
@noimplement, @noextend etc.
Its a classic : http://www.eclipse.org/eclipse/development/java-api-evolution.html
6. In order to enforce API Analysis we should refer to - http://www.eclipse-tips.com/tutorials/26-api-tooling-tutorial. After all Eclipse is meant for coding clean interfaces and abstract classes that communicates to users through simple annotations and robust patterns.
7. Its not a bad idea to enforce internationalization – using the setting - org.eclipse.jdt.core.compiler.problem.nonExternalizedStringLiteral=error in .settings file.
Fixing Int issues at the early stage prevents from wasting a good amount of time and introducing unsolicited bugs at the time of product delivery phase.
8. we should flag 'unused imports' as errors in preference to make it a daily habit getting rid of unnecessary evils.
9. Templating try / catch to actually catch and log an exception is a MUST ! Eclipse should fix this by default providing a exception.printStackTrace() statement. Empty catch blocks are silent killers that remain hidden inside deeply nested api !
10. Remote Debugging Options :
-vmargs
-Xdebug
-Xnoagent
-Djava.compiler=NONE
-Xrunjdwp:transport=dt_socket,server=y,suspend=n,address=9000
-Xdebug
-Xnoagent
-Djava.compiler=NONE
-Xrunjdwp:transport=dt_socket,server=y,suspend=n,address=9000
11. How to enforce annotations for api ?
http://www.eclipse-tips.com/tutorials/26-api-tooling-tutorial
-- enforce usage of @since, @noimplement annotations
-- enforce usage of @since, @noimplement annotations
12. How to view OSGi dependency and search plugin dependency ?
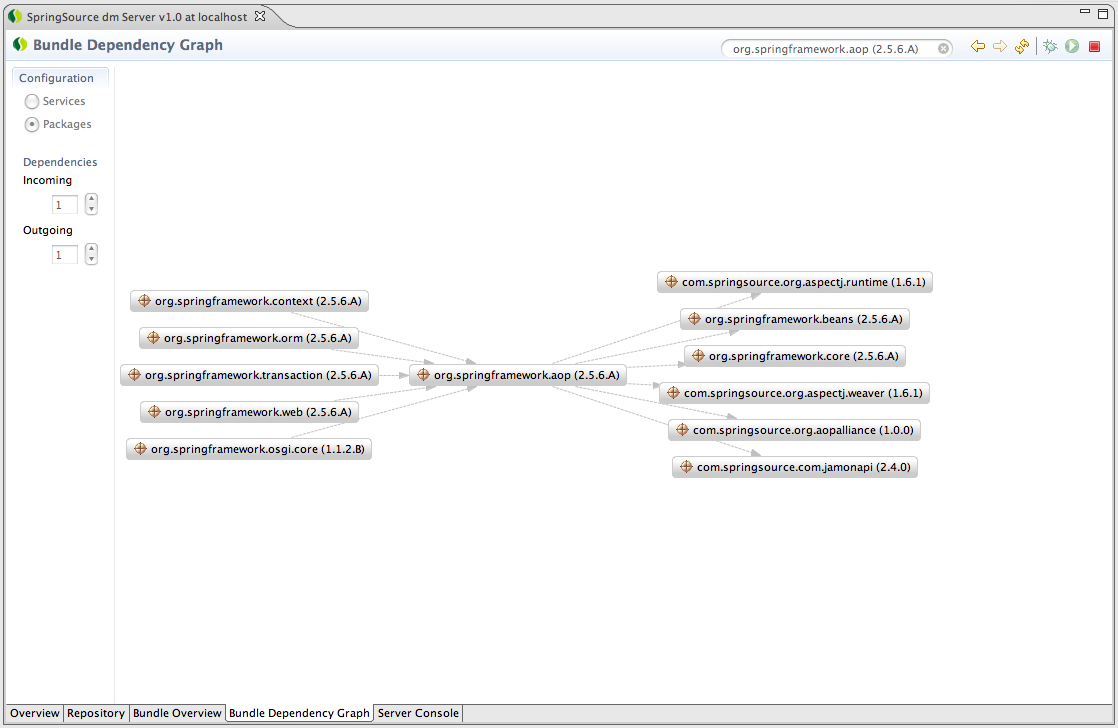
13. The last but not the least FindBug (http://findbugs.cs.umd.edu/eclipse) should be part of development environment and be actively used.
Well ... a bonus tip for hackers :-) ... don't forget the decompiler plugin -http://java.decompiler.free.fr/jd-eclipse/update- using which you can even debug any class that essentially do not have source base shipped with its tool !
1 comment:
Sysdao is a great Productivity Tool for Web App Development :
#1 http://www.eclipsetotale.com/tomcatPlugin.html#A3
#2 http://keyboardsamurais.de/2004/01/15/tomcat_tutorial_helloworld_for_complete_fools_-_english/
Sysdeo Tips & Tricks
Configure Project
-----------------
> Right click on your project and select Properties
> Select Tomcat from the properties list
Configure the General tab:
--------------------------
> Check the "Is a Tomcat Project" box
> Enter the context name
> Ensure checkboxes match the image
Enter your web application root (where your web.xml is located)
Configure the DevLoader Classpath
---------------------------------
> Check the "Activate DevLoader" box
> Check all libraries needed by your application, even if they are referenced via the MANIFEST file
> Click OK
> Start Tomcat using the plugin buttons
> Browse to your application
Post a Comment